The Satellite Pass Directly Overhead Is the One You Cannot Use
Predicts when a radar satellite can actually image a spot, which is not the same as when one flies over it. About a quarter of passes are usable, and the best-looking ones are the worst.
Pick a point on the ground and this tells you when ICEYE or Umbra will be in a position to put radar on it, how to aim a corner reflector when they do, and hands the whole thing to ATAK as a data package. It reads orbital elements from Celestrak by name, so nothing is pinned to a NORAD ID that can quietly start pointing at the wrong object.
Try the browser preview — no install. It pulls the orbital elements and does the propagation in your own browser, so where you look never reaches my server. The desktop tool adds the ATAK package, notifications, a menu-bar watcher and cross-checking against a commercial archive.
For a while it confidently recommended the worst possible passes.
A radar cannot photograph what is directly beneath it
Synthetic aperture radar has to squint. If it looked straight down it could not tell a return arriving from the left of the track from one arriving at the same range from the right, so every SAR points off to one side. That single fact reorganises the whole problem.
The number that follows is incidence: the angle the beam makes with the vertical where it lands. That is not 90° minus elevation. Elevation is how high the satellite sits above the horizon at the site. Incidence is solved from the earth-centre / satellite / site triangle — this pass's altitude and the slant range to you. Look angle at the satellite is smaller than incidence because Earth is curved; they meet only at nadir. A satellite at 89° elevation is still about 1° incidence and cannot image you.
The tool treats 20° to 45° incidence as usable. That range is a working convention rather than a derived constant — real sensors quote narrower and mode-dependent limits, and the quality curve inside it is explicitly labelled a heuristic in the code. What is not a convention is the direction: higher elevation is worse, not better. The first run draws the best window in that band and labels it BEST 20–45°.
The ground it can image is not beneath the track either, and the offset is not a fixed ribbon. Solving that same triangle for the two ends of the incidence window puts the imageable band, for a satellite at 570 km, about 189 to 504 km off the ground track. A 520 km bird and a 650 km bird do not share those numbers.
| distance from the ground track, 570 km bird | |
|---|---|
| nadir blind zone | 0 – 189 km |
| usable band | 189 – 504 km |
Two bands, one either side, and a corridor almost 400 km wide underneath them where the satellite is directly overhead and can see nothing.
Measured over three sites for 24 hours, of the passes clearing 20° elevation only 23–26% are usable. At every one of those sites the highest pass in the day was above 88° elevation — under 1.5° incidence, and unusable.
What it does with that
Passes come from Skyfield propagation of live Celestrak elements, cached to disk for two hours because elements do not move that fast and the map re-runs on every click. Skyfield and requests are the only runtime dependencies. Each pass is scored by how close its incidence sits to the mid-band optimum around 32.5°, not by elevation. Anything outside 20–45° is not a weak opportunity, it scores zero and is dropped.
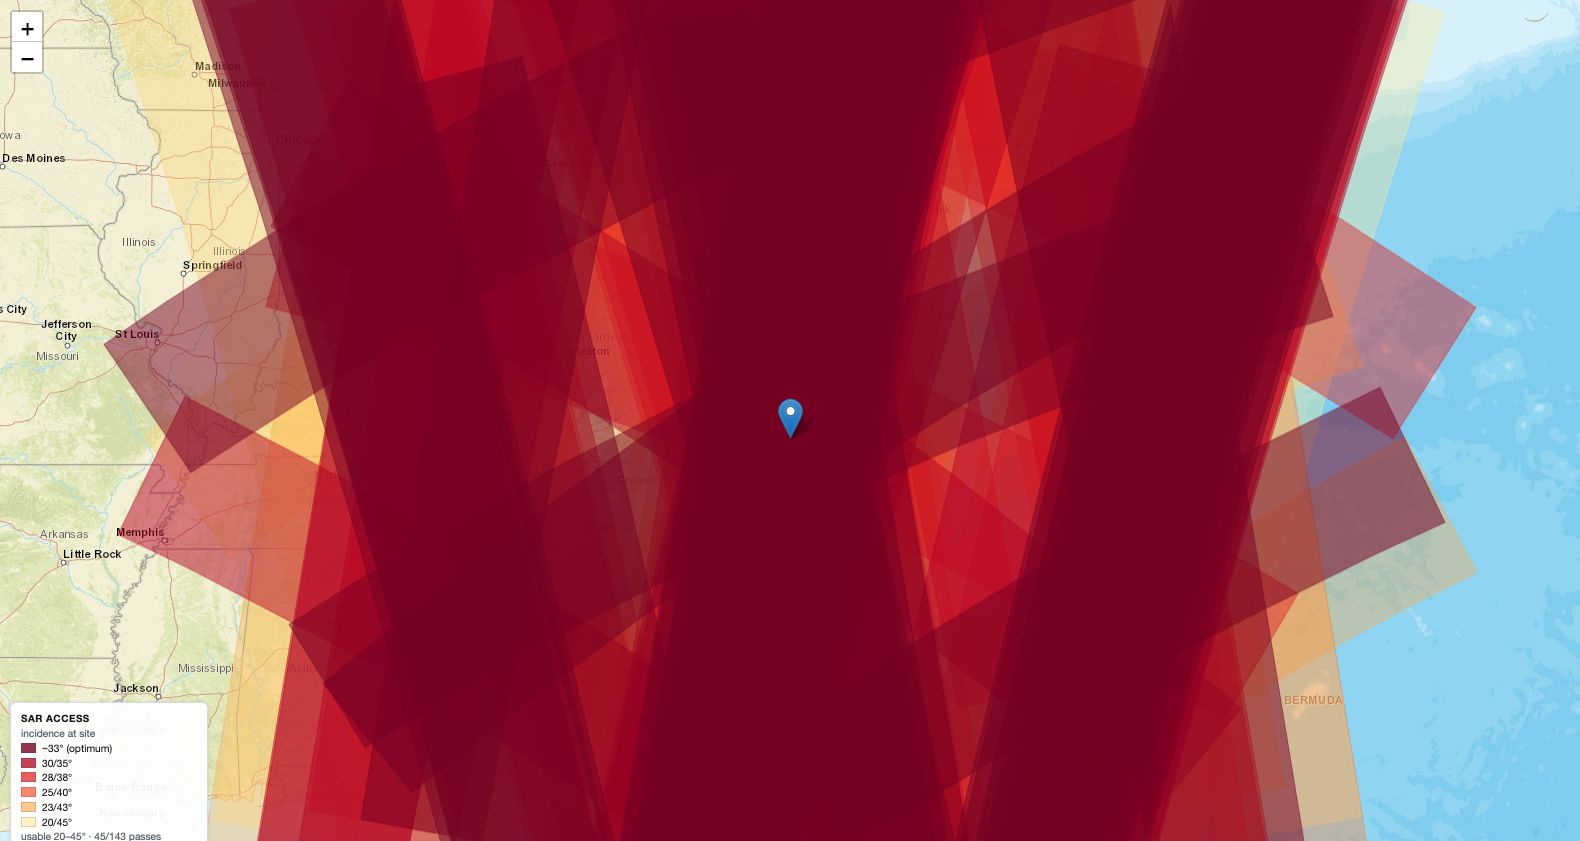
The map, which is where most of it lives, draws the two access bands per pass, shaded with ColorBrewer YlOrRd. The ground track is drawn dashed and labelled as the blind zone, because the instinct to stand under it is exactly wrong.
The ATAK export writes a Mission Data Package whose CoT events carry start/stale times bracketing the pass, offset by your setup lead. On the tablet the geometry appears when it is time to deploy and ages off afterwards. Nobody consults a schedule; a marker shows up.
There is also a tasking order, because the output of all this is a person standing somewhere holding a panel. It carries the site name, the MGRS grid and lat/lon, an up-by time, a down-after time and the peak as date-time groups, the aim azimuth and elevation, the satellite and whether the pass is ascending or descending, and the incidence angle.
Plus a 65-character brevity line for voice or SMS. The azimuth is a setup instruction rather than decoration, because a trihedral's 3 dB beamwidth is only about 40° full width — hold aim within roughly ±20° of boresight.
What broke
The overlay was drawn in the blind zone. The first version put a 30 km corridor straight down the ground track and shaded it as the imaging swath. That corridor is centred on the one place a side-looking radar categorically cannot image. It rendered beautifully. Every test passed, because the test measured that the corridor was 30 km wide — and never once asked where it was.
Then the fix reached two of four places. Correcting the geometry meant changing every site that decided where the imageable ground is. I changed the map overlay and the coverage KML, and left the CoT package and its sibling KML still drawing the old corridor. For a while the tool shipped two ATAK export paths encoding opposite geometry, with a comment at the top of the file describing the bug in the past tense. Nothing failed. Both paths produced plausible polygons.
The same split ran through the ranking. Passes were ordered by peak elevation everywhere at first. I fixed the terminal listing and the overlay, and the ATAK export kept sorting elevation-descending, so asking it for the best five passes in a window returned the five least usable and wrote them to the tablet.
A geometry bug does not announce itself. It renders. The overlay was beautiful, the tests were green, and the polygon was in the one place radar cannot see.
Both are now regression-tested. Writing those tests was its own lesson: the first version of the blind-zone check skipped any polygon not already named as an access band, which meant that against the actual historical bug, a corridor exported under a different name, it inspected zero vertices and passed. A test that cannot fail is worse than no test, because it reports confidence. It now inspects every exported area polygon except the access disc, and holds each vertex to the real 189 km near edge.
A coordinate that was wrong by 216 km. The tool reads areas of interest from a shared config and takes the centroid of each WKT polygon. A closed ring repeats its first vertex last, and averaging the raw list double-counts that corner. Writing tests for the geometry surfaced it, and the Ukraine AOI moved 216 km when it was fixed. Every prediction for that area, for as long as it had existed, had been for the wrong place.
MGRS that agreed with itself. Tasking orders needed grid references, and I already had a converter from an earlier project. It hardcoded "AA" as the 100 km square instead of deriving the letters, and truncated the meridian-arc series to its first term, which costs about 15.8 km of northing at 50° latitude. Its own inverse function computed the square letters properly, so forward and inverse did not round-trip. (Both are fixed in that earlier tool now, along with a third defect found on the way: its decoder mishandled MGRS band X, which is 12° of latitude rather than 8, and put Svalbard about 8,000 km from where it belongs.) I wrote a fresh one and validated it against two independent implementations rather than against a second function of my own — a homegrown forward and inverse agreeing with each other proves nothing. Both oracles are test-only, and nothing at runtime imports them. The fuzz test caught a crash of my own within minutes: band X spans 12° of latitude rather than 8, so anything above 80°N indexed past the end of the table.
A true/false value that would not write out. The orbit library returns its own number types. Most of them behave like ordinary numbers and save fine. Its true/false value does not, and it took the whole feed down the first time a pass was written to a file.
A production-only CSS refusal. The browser build's legend swatches came out blank on the live site with nothing but a console error. Setting el.style.background is exempt from style-src 'self' — but I built the element and then serialised it through outerHTML, which turns that assignment into an inline style= attribute, which is refused. A local server sends no policy at all and rendered it perfectly. The fix was to append live DOM nodes instead of markup.
A number I made up. The tasking order tells an operator how tightly to aim, and I wrote that tolerance as ±40° from memory, with no source, and then repeated it in nine places across two codebases and this page. It was wrong by a factor of two: ~40° is the full 3 dB beamwidth, so the half-angle is ±20°. It was also outside the reflector's support entirely — a trihedral returns nothing past 35.26° off boresight, because beyond that the ray can no longer strike all three plates.
Settling it took a ray-tracer rather than a search: trace rays into three mutually perpendicular plates, keep the ones that bounce off all three, and measure the area that survives. Validating it was the important half. The peak it computes lands within 0.2% of the closed-form σ_max = 4πa⁴/3λ², which is what makes the off-axis numbers worth anything. The −3 dB point comes out at 19.4°, near-identical in every azimuth.
That derivation is kept as a standalone script, so the number has a reason rather than an author. Finding all nine copies took two searches, because one of them was HTML-entity-encoded as ±40° and the first pattern walked straight past it.
Zero-size maps zoom to street level. A Leaflet container sized by height: 100% inside a flex column can measure 0×0 before layout settles, and fitBounds on a zero-size map silently snaps to maximum zoom. The symptom is not an error, it is a close-up of empty tiles.
The browser build is a port, and ports drift
The preview runs the same geometry in JavaScript. SGP4 comes from satellite.js, which I checked against Skyfield before building anything on it: 0.0005° of elevation and 45 m of subpoint across 90 cases. That one was a throwaway harness and survives only as a comment, which is the weaker half of this story. Every ported piece, though, is checked against the desktop original — grid references, ground range, the quality curve, the palette, band construction, date-line splitting, pass finding and the tasking text.
That diff is a file rather than a claim in a comment, and it found two real bugs. The JS antimeridian split never closed its rings, so pieces came back one vertex short. And a pass already in progress when the window opens has no rise crossing to trigger on, so it was silently dropped — one pass out of 83.
Browser propagation of 59 satellites over 24 hours takes under a second.
The thing worth keeping
Every bug here rendered correctly. The nadir corridor drew a clean polygon. The elevation ranking produced a confident, well-formatted "BEST" line. The centroid returned a coordinate in the right country. None of them looked like failures, and the tests that existed all passed, because they tested that the code did what I had told it to do rather than what the physics required.
The one that took longest to see was not the original mistake but its repair: I fixed the geometry in the two places I was looking at, and the other two kept the old behaviour for days while a comment at the top of the file declared the bug fixed. If you correct a rule that appears in more than one place, go and count the places first.

Comments