Live Bathymetry for Google Earth, ATAK, and a Chartplotter
Live water depth for any area you pick, exported for Google Earth, ATAK, QGIS or a chartplotter.
Pick an area, get real water depth: charted soundings, survey grids and multibeam, colour-ramped into a depth map you can actually read.
It exports for whatever you are carrying — Google Earth, ATAK, QGIS, a chartplotter, or a printed PDF — and works offline from what it has already pulled. No account, no API key.
Try the browser preview — no install, no account, nothing to run. It draws the same depth map from the same NOAA charts, in your own browser: where you look never reaches my server, because on my side there is no server to reach. It is a preview because it reads NOAA's electronic charts and nothing else; the desktop tool below also pulls BlueTopo and USACE survey grids, merges them shallowest-wins, applies the tide, and writes the GeoTIFF ATAK will import.
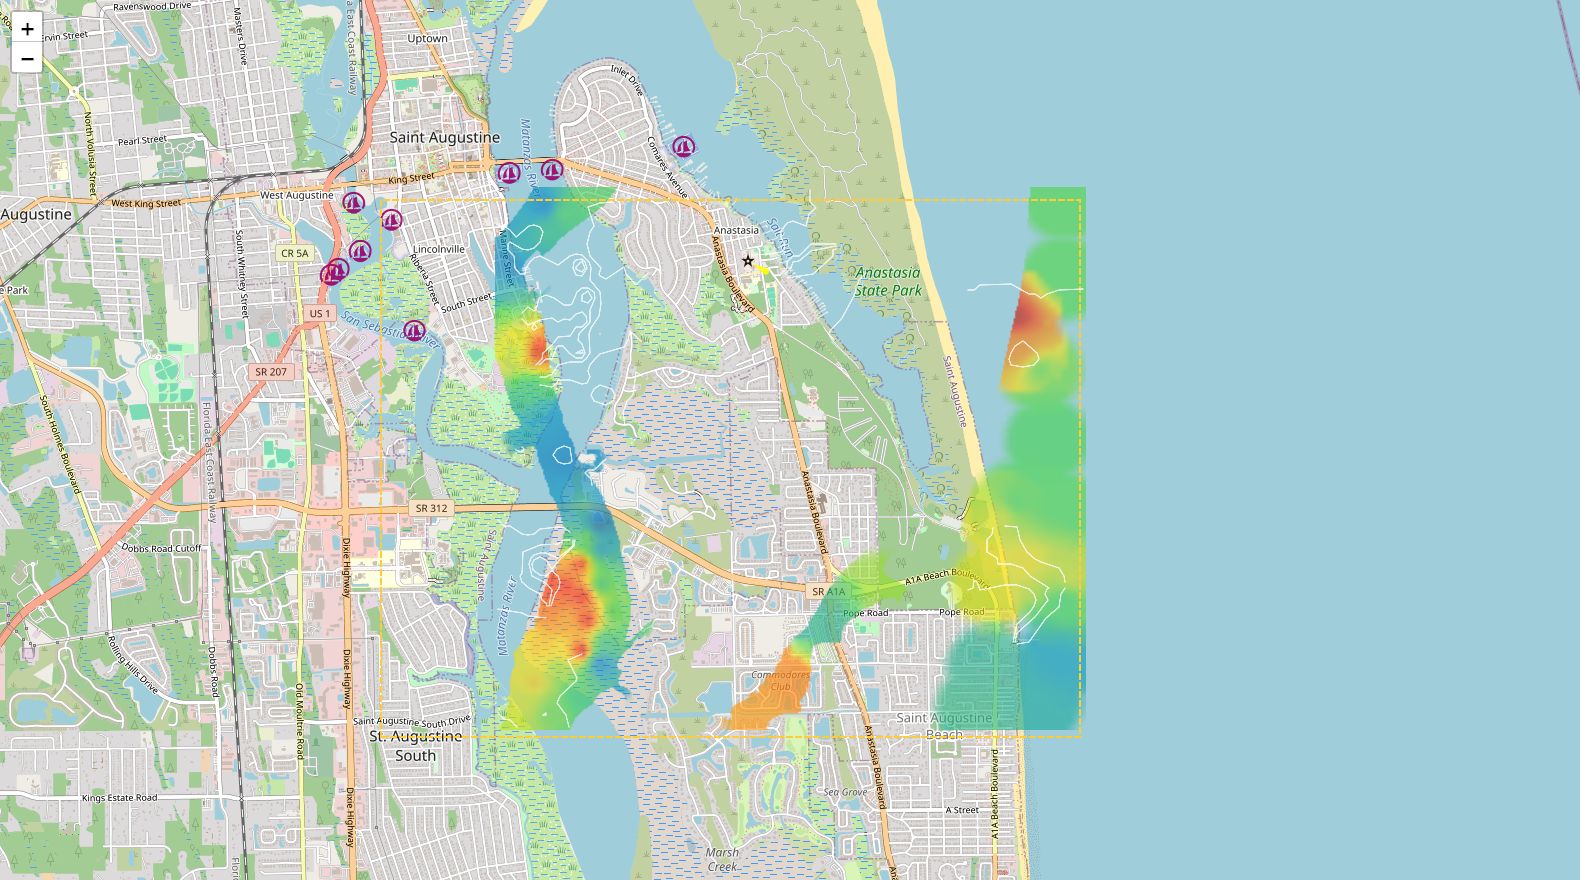
The arithmetic is not a rewrite that drifts. The browser version is checked against the desktop tool cell by cell — the depth grid, the confidence grid, the charted-water mask and every contour vertex — and it does not ship unless they agree exactly. Writing that check turned up a real bug in the desktop tool, below.
One render, three containers
The constraint that shaped the exports: every viewer renders the "same" KML differently. The first ATAK export looked perfect in Google Earth. In ATAK, the water-mask polygons drew as stray blue lines because ATAK ignores KML folder visibility, and the ground-overlay PNG rendered with wrong colours. So ATAK gets a points-only KMZ plus a GeoTIFF twin of the exact same pixels, Google Earth gets the full overlay KMZ, and QGIS gets the GeoTIFF. Same render, three containers, because the alternative is an export that is quietly wrong on someone else's screen.
The subtlest bug in the project lived here too. Sizing the grid with a ceiling function looks harmless, but it rounds the pixel count up past the declared corner of the overlay box, so the image ends up a fraction of a cell larger than the box that claims to contain it, and every viewer silently stretches it into place. Nothing errors. The chart is simply in slightly the wrong spot, by less than you would notice and more than you would want when the question is whether a shoal is inside a channel.
The fix is to derive the box from the raster rather than the other way round: take the northern and eastern edges as the southern and western ones plus a whole number of cells, so the declared extent and the pixels are the same statement. Any georeferenced raster export has this bug available to it, and the only reliable way to catch it is to load the output somewhere that draws a coastline and see whether the water lands on the water.
Pessimistic is the right kind of wrong
Depths stay at charted MLLW, the conservative datum. The current tide is shown as text but never recolours the map, because ENC soundings are deliberately shoal-biased and a depth map should inherit that bias, not launder it. The optional composite mode goes further and keeps the least water any source ever measured for a cell.
The auto-computed "seaward" bearing is a good example of knowing a number's worth: measured at St. Augustine inlet it pointed 180 degrees, into the scour hole in the inlet throat, when the Atlantic is nearer 100. Off by 60 to 80 degrees. So it is printed as a suggestion and never applied automatically; you confirm it with a flag.
Living with other people's servers
Everything HTTP goes through a disk cache with retry underneath. Offline mode serves any cached copy regardless of age and fails a miss immediately instead of burning 35 seconds of retries, and what it deliberately does not do is interpolate from a neighbouring area and pretend. Field lessons that ended up as code:
- Both of api.weather.gov's structured forecast endpoints answer "Marine Forecast Not Supported" for marine zones, confirmed live. The marine weather panel parses the legacy free-text Coastal Waters Forecast bulletin, because that is the one that works.
- eHydro's index keeps every historical survey: one stretch of the St. Johns River returned 88 overlapping records. Dedupe to the newest survey per channel, cap the ZIP downloads at five.
- A wide area at a fine cell size silently allocates hundreds of megabytes and then spends minutes in the contour pass, which looks exactly like a hang. A 1.5 million cell cap coarsens the grid instead, and says so.
- The geofence tracer, on its first attempt, treated land as missing data: channels with land on both banks produced broken contours and the main channel got discarded, confining a hypothetical USV to a puddle. Learned by rendering the first attempt and looking at it.
Getting it
Start with the browser preview. It needs nothing installed, it draws the same depth map from the same charts, and for most of what people want from this — what does the bottom look like in that inlet, can I get in there — it is the whole answer.
The desktop version is the full instrument: BlueTopo and USACE survey grids alongside the charts, shallowest-wins compositing, tide, the survey-confidence layer, the ATAK GeoTIFF, offline operation from its own cache, and a way to pull a list of areas on a schedule. I am not putting it up as a download. It reads depths that someone might steer by, and I would rather know who is running it and what for than watch a zip go around detached from every caveat on this page.
There are 892 offline tests, and a separate opt-in live suite whose docstring says the honest thing: a failure there means go look, not the build is broken, because it is testing other people's servers.
That live suite is where the worst bug in this project turned up, and it had been shipping for the life of the feature. The water-only mask asked NOAA for four named fields including OBJECTID. The harbour-scale layer has it. The approach-scale layer has fifteen fields and no object id at all — and ArcGIS rejects the whole query with a 400 when you name a field a layer lacks. So every pull ever made built the mask from harbour polygons alone: 61 approach-scale polygons missing at St. Augustine, 57 at Long Beach.
It never threw. The error was caught, appended to a warnings list, and read like ordinary upstream flakiness — while the retry layer patiently tried each doomed query four more times. The fix is one word, *, which costs 1.5 to 4.4 per cent more bytes because geometry dominates the payload, and cannot break again the next time NOAA changes a schema.
What I would tell you before you start: golden-file tests earn their keep the day a cosmetic-looking diff appears. Those files get parsed by ATAK, Garmin, QGIS, and Mission Planner, none of which the tool can run, so a diff you cannot explain line by line is a bug report from a device you do not own.

Comments