I Built a Home Run Predictor and It Does Not Work
Where tonight's home runs land — park history picks the seat, a two-lobe spray draws the cloud, and a scored season says how often that works.
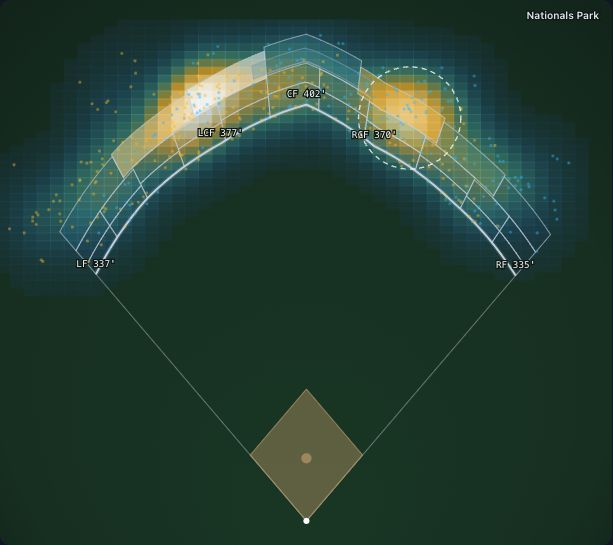
Pick a real game and it pulls the lineup and the forecast, simulates several hundred home runs off that lineup's Statcast spray charts, and colours in which seats they land in.
Then it tells you that you should probably ignore the answer.
Try the browser preview — nothing to install, and your own browser does the schedule, the weather and the physics. There is no server.
The number that shaped everything else
I re-scored the 2026 season through 10 Sep — 4,997 home runs, 1,910 completed regular-season games, all 30 parks. Weather held identical across arms. No peeking.
| Predictor | top-1 | top-3 | spray MAE |
|---|---|---|---|
| Broken (everyone a righty) | 21.1% | 48.0% | 26.64° |
| Shipped (park history + two-lobe spray) | 23.2% | 51.2% | 17.3° |
| Monte Carlo only (bimodal, no park table) | 18.3% | 48.2% | 17.3° |
| Area share of the shipped top-k | 15.2% | 39.3% | — |
| Handedness-only | 17.4% | 61.4% | — |
Spray got better. The one-seat pick is now the park table, on purpose — a mixed lineup does not collapse to one section, so Monte Carlo alone hits 18.3% at top-1. Shipped top-1 matches prospective climatology and beats its own area share.
The model lands in its own recommended sections less often than their share of the seating area. You would do better throwing a dart at a seating chart weighted by section size, and much better asking one question: does this guy bat left or right?
Sitting in the top-ranked section, a home run would have reached you in 14.6% of games. The model claims that section is worth 24.7%. It delivers 16.9%.
The one thing that survives an area-weighted null and park-clustered inference: pick five sections covering 70% of the seats and you catch 76% of home runs. That is the entire demonstrated edge.
Why it was wrong
The backtest found the cause, and it is one query parameter.
The roster endpoint at statsapi.mlb.com returns each player as {id, fullName, link} unless you ask it to hydrate batSide. I never asked. The lookup fell through to a default of "R", so 11,065 of 11,069 cached batter profiles were labelled right-handed. The model separated lefties from righties by −0.35° of predicted spray. Reality separates them by 40.3°.
It could not tell which way anyone pulls. Everything downstream — the spray chart weighting, the section probabilities, the seat ranking — was doing careful arithmetic on a lineup of nine identical right-handers.
Nothing about the output looked wrong. That is the part worth sitting with. The maps were plausible, the probabilities summed correctly, the confidence intervals were reasonable. It took a scored backtest against real outcomes to notice, because a wrong answer that looks right is indistinguishable from a right one until you check.
While porting it to the browser I found the same bug a second time, in the confirmed-lineup path that runs three hours before first pitch. Against a real posted card it reported 18 right-handed batters where the truth was nine left, six right and three switch.
The port, and why it is exact
The browser version is not a rewrite that agrees roughly with the desktop tool. It runs the same simulation.
That meant reproducing the desktop tool's random-number generator in the browser — not a generator, but the same one, including the 256-level lookup it uses for normals, and weighted choice. The lookup tables are not published anywhere useful, so I recovered them with 1,026 controlled draws. One of the 256 came back wrong and was caught by the layer boundaries losing order, not by anything in the output looking unusual.
Two things that would have passed any statistical test:
normal(mu, sigma) matched 1,553 of 2,000 draws. The C reads loc + scale * z, and the compiler contracts that into a fused multiply-add: one rounding, not two. JavaScript has no FMA, so it emulates one with error-free transformations.
And modulate_carry rounds its own return values, which the sampler then reads to place the ball. Returning full precision put every simulated home run about ten feet from where the desktop tool puts it — close enough that every summary statistic still looked right.
The check is 125,636 exact comparisons with no tolerance band, including all 2,758 simulated landing points and every one of 98,304 density-grid cells. A tolerance would have meant never finding out which of the two was wrong.
What it is good for
The uncertainty is honest even when the location is not: the stated spread is 27.3° against an actual 29.0°. The shape is wrong — unimodal over centre field where the truth is bimodal out to the pull sides — but the width is not lying to you.
And it is a decent way to look at a ballpark. Coors Field at altitude, the Green Monster eating what would be home runs anywhere else, a dome with no wind in it, the way a 15 mph southerly is a carry boost in one park and dead-in wind in another 40 miles away. That part is real physics and it shows.
The handedness channel is open, the spray is two lobes, and the one-seat pick is park landing history. The season re-score above is that answer — spray MAE down to 17.3°, shipped top-1 at 23.2%.

Comments